Ibiza Property Market
Below is our unique, data-backed guide to the Ibiza property market:
- Snapshot of Ibiza Villas and Houses
- Price Band Distribution of Villas and Houses
- Percentage of Ibiza Villa Listings above Price Point
- Snapshot of Ibiza Apartments and Penthouses
- Price Band Distribution of Apartments
- Percentage of Ibiza Apartment Listings Above Price Points
- Price Trends: Ibiza Municipalities (2016–2025)
- Price Trends: Spain vs Ibiza (2016–2025)
- Ibiza Rental Yields
- Looking Forward: 2025 and Beyond
Our method uses in-house analysis of 2,000 live Kyero listings dated 24 July 2025, broken down by property type: villas and houses vs. apartments and penthouses. For historical price trends, we use a decade’s worth of cleaned data from Idealista. Our goal is simple: to give you a clear, comprehensive, and independent view of the market, so property investors can make confident, well-informed decisions about Ibiza real estate
Snapshot of Ibiza Villas and Houses
| Price Band (€) | Listings | % of Total |
|---|---|---|
| €0–500K | 9 | 0.7% |
| €500K–1M | 85 | 6.8% |
| €1M–1.5M | 104 | 8.3% |
| €1.5M–2M | 119 | 9.5% |
| €2M–2.5M | 87 | 6.9% |
| €2.5M–3M | 135 | 10.7% |
| €3M–3.5M | 129 | 10.3% |
| €3.5M–4M | 131 | 10.4% |
| €4M–5M | 129 | 10.3% |
| €5M–7.5M | 204 | 16.2% |
| €7.5M–10M | 67 | 5.3% |
| €10M–15M | 35 | 2.8% |
| €15M–20M | 12 | 1.0% |
| Over €20M | 10 | 0.8% |
- Average listing price for Ibiza villas and houses: €4,206,807
Calculated using weighted averages
Percentage of Ibiza Villa Listings above Price Point
| Over €500K: • Ibiza: 99.3% |
Over €1M: • Ibiza: 92.5% |
Over €2M: • Ibiza: 77.4% |
| Over €3M: • Ibiza: 60.5% |
Over €5M: • Ibiza: 28.1% |
Over €10M: • Ibiza: 4.6% |
As a clear justification of Ibiza’s status as a luxury investment destination, the most common price bracket for villas and houses is €5–7.5 million, and a staggering 77.4% are priced over €2 million. To put this in perspective, only around 9% of homes in London are valued at £1 million or more, according to the Evening Standard. For those looking for an affordable villa or house in Ibiza, just 7.5% of listings are priced under €1 million.
60% of Ibiza villas and houses are priced over €2 million, and nearly a third command price tags of at least €5 million. The distribution extends well into the super-luxury sector - even at the €10 million level, around 5% of listings are priced at this point or beyond.
View our full selection of Ibiza villas for sale, including sea view houses, modern builds, and countryside fincas.
Price Band Distribution of Villas and Houses
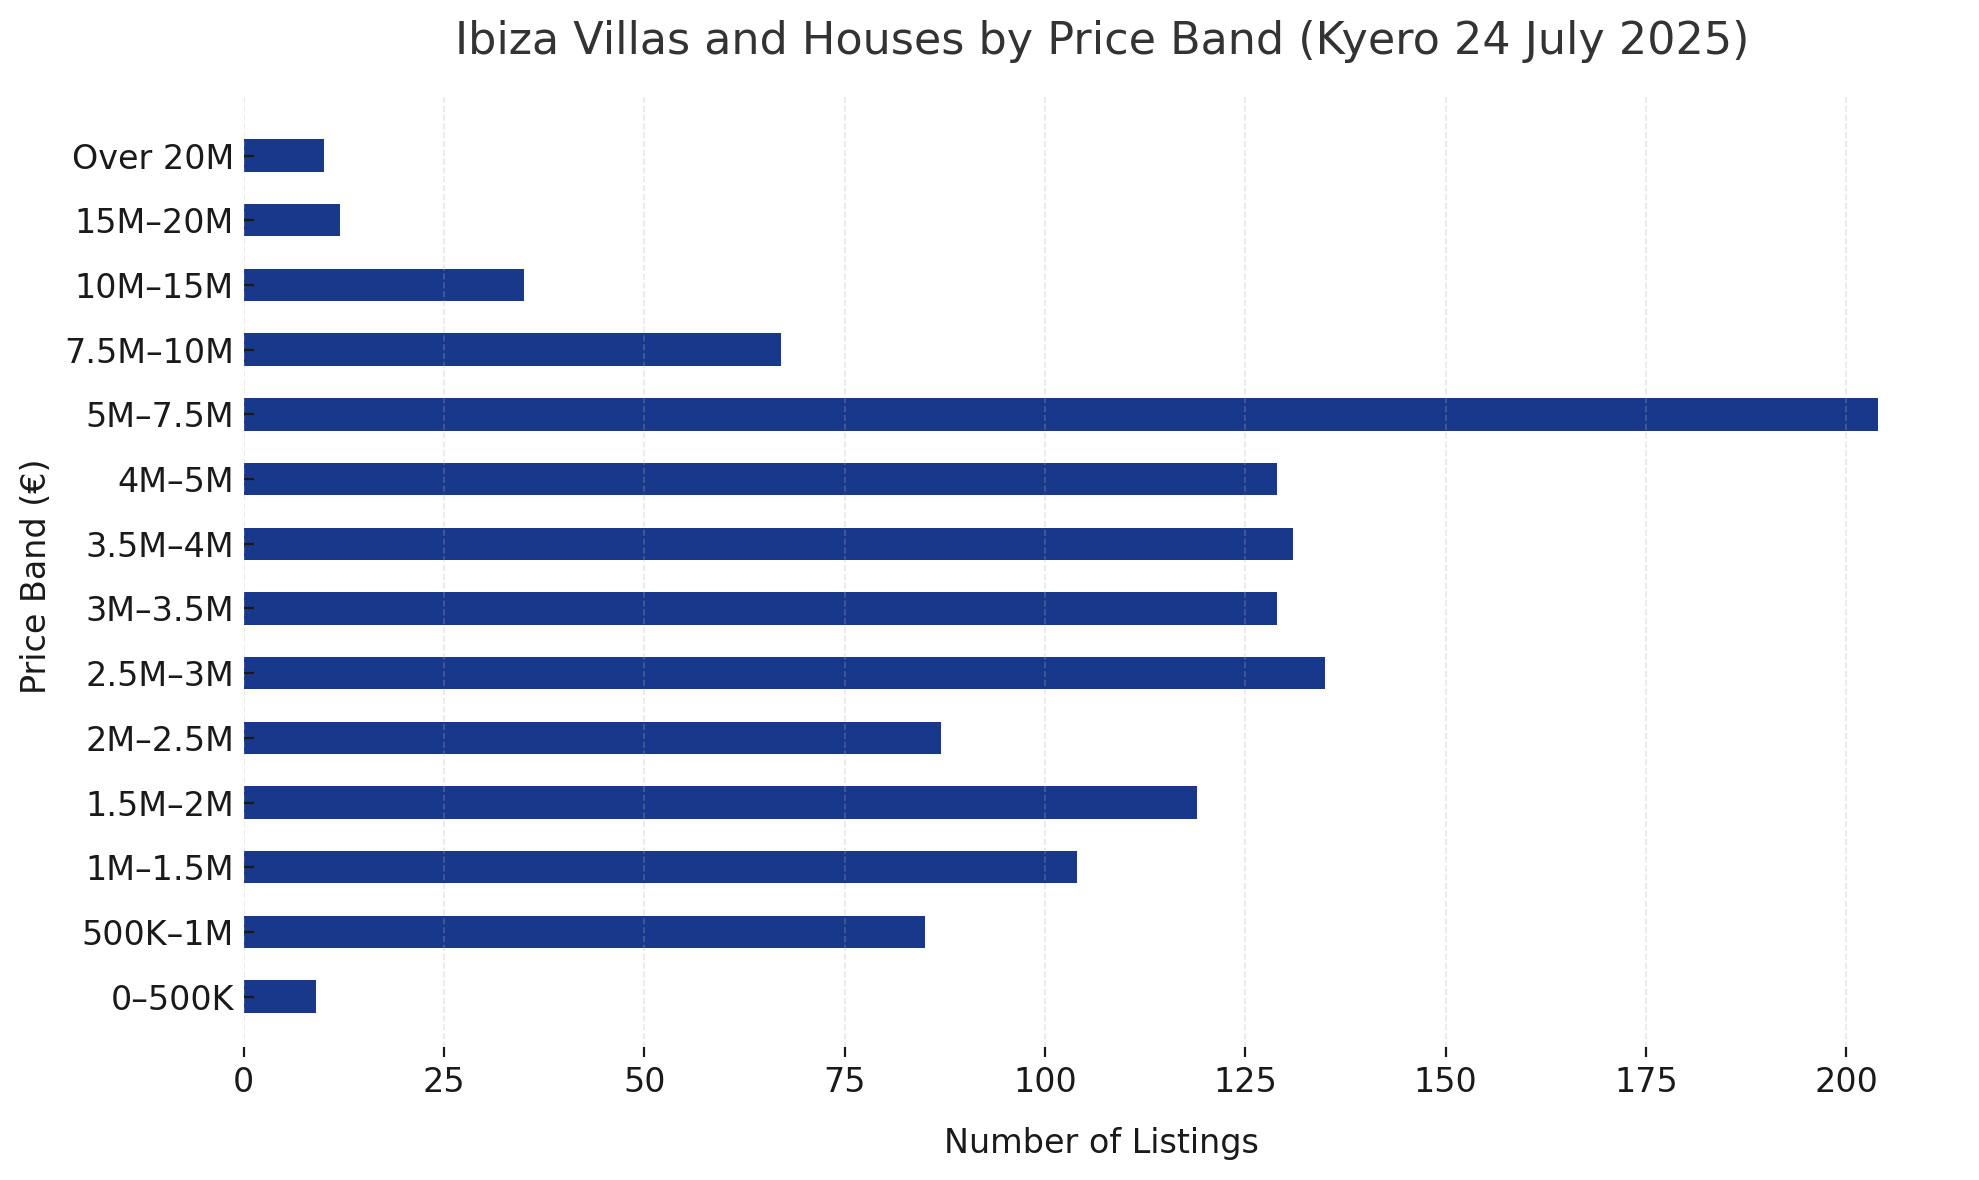
Source: Kyero
Snapshot of Ibiza Apartments and Penthouses
| Price Band (€) | Listings | % of Total |
|---|---|---|
| €0–200K | 0 | 0% |
| €200K–300K | 35 | 4% |
| €300K–400K | 38 | 5% |
| €400K–500K | 37 | 5% |
| €500K–600K | 65 | 8% |
| €600K–700K | 101 | 13% |
| €700K–800K | 106 | 13% |
| €800K–900K | 72 | 9% |
| €900K–1M | 41 | 5% |
| €1M–1.25M | 66 | 8% |
| €1.25M–1.5M | 65 | 8% |
| €1.5M–1.75M | 46 | 6% |
| €1.75M–2M | 25 | 3% |
| €2M–2.5M | 30 | 4% |
| €2.5M–3M | 21 | 3% |
| €3M–4M | 24 | 3% |
| Over €4M | 14 | 2% |
- Average listing price for Ibiza apartments and penthouses: €1,142,920
Calculated using weighted averages
Percentage of Ibiza Apartment Listings Above Price Points
| Over €500K: • Ibiza: 82.9% |
Over €1M: • Ibiza: 54.9% |
Over €2M: • Ibiza: 24.2% |
| Over €3M: • Ibiza: 10.2% |
Over €4M: • Ibiza: 4.0% |
Over €5M: • Ibiza: 1.0% |
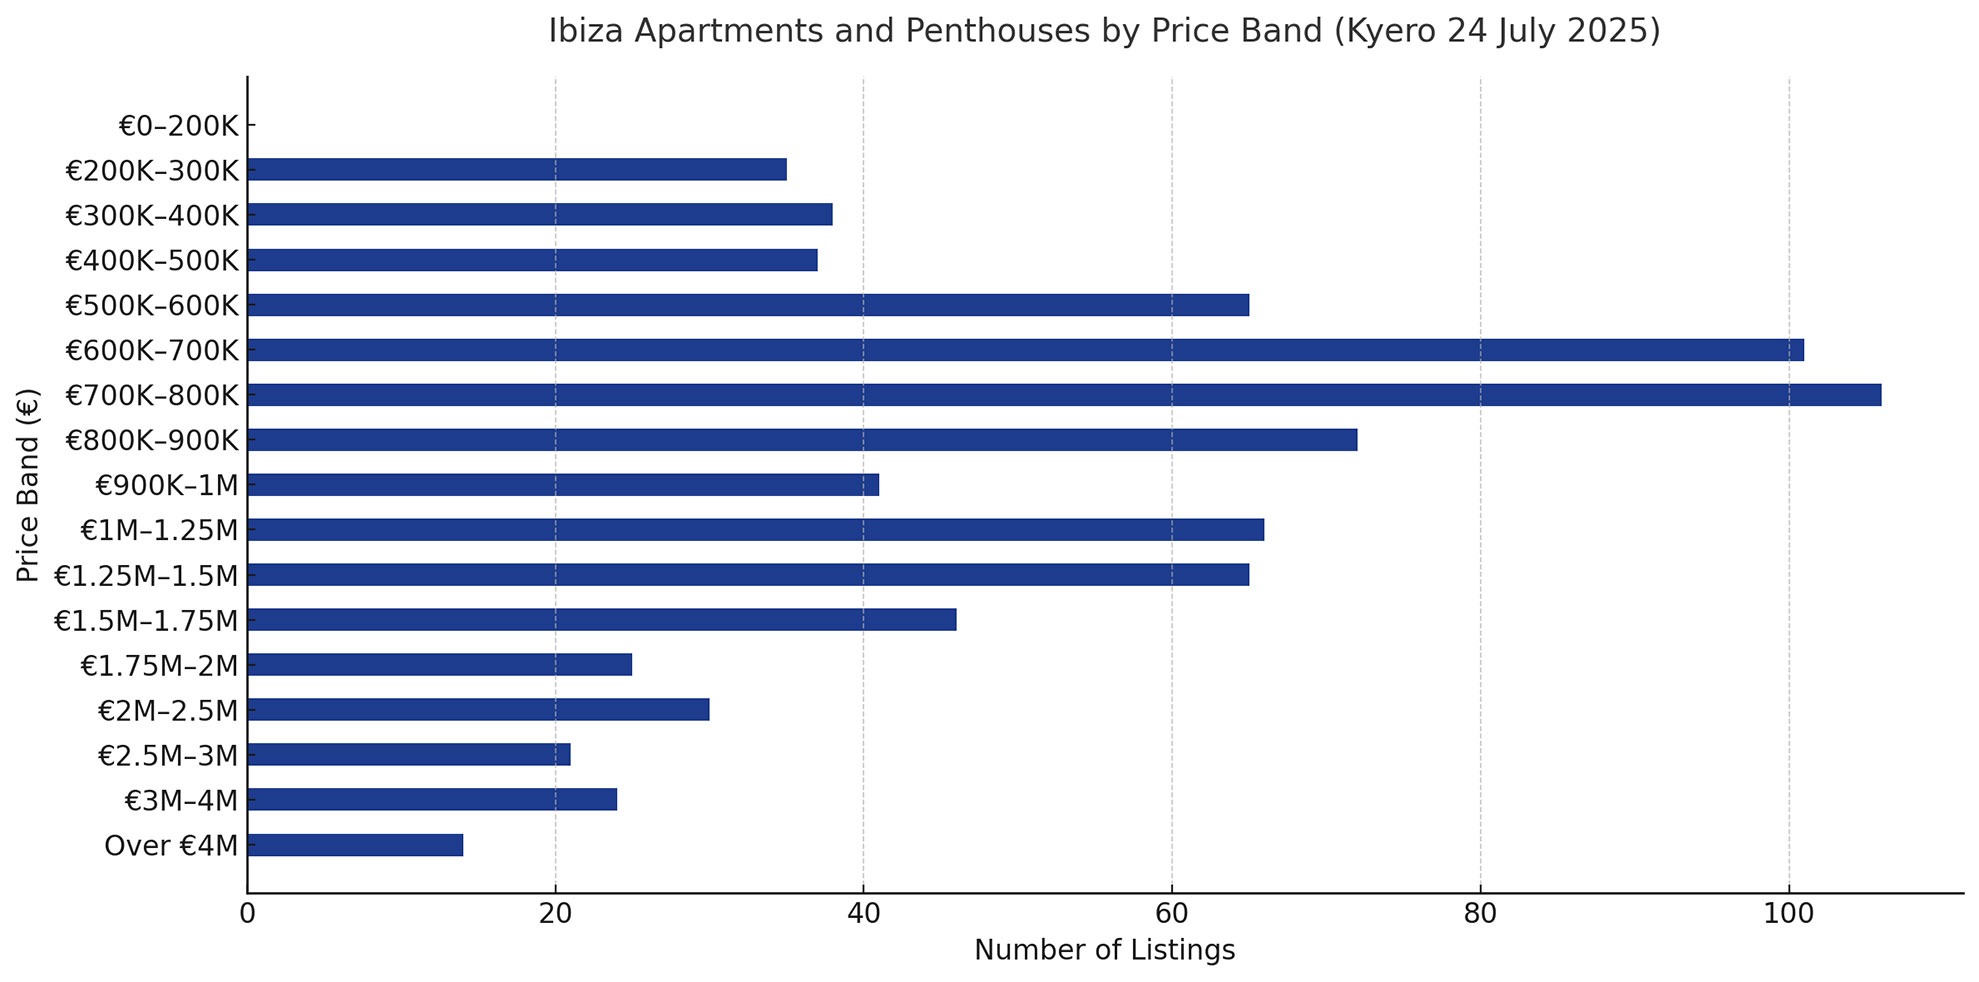
Looking at the price distribution of apartments and penthouses in Ibiza, the most common price band is between €600K and €800K, with over a quarter of the total units falling into this bracket. Reconfirming the luxury status shown by the price distribution of its villas, over half of the apartment listings are priced above €1 million, and nearly a quarter are above €2 million. As a point of reference, according to Spain-Real.Estate.com, as of 31st July 2025, the average price of an apartment in Madrid is €648,789. According to Idealista (July 2025), Madrid is 76% more expensive than the Spanish average - this compares to our average apartment price for Ibiza of €1,142,920.
Share of Sub-€500K Apartments in Ibiza Compared to the Balearics
To put the affordability of apartments into perspective, in percentage terms, nearly twice as many apartments are priced under €500K across the Balearic region compared to Ibiza - in other words, sub-€500K apartments are twice as rare in Ibiza.
| Source | % Under €500K |
|---|---|
| Kyero & Idealista (Balearics) | 35.8% |
| Ibiza only | 17.1% |
Note, Balearic figures sourced from over 13,000 listings across Kyero and Idealista on 31st July 2025.
Price Band Distribution of Apartments
Price Trends: Ibiza Municipalities (2016–2025)
| Year | Eivissa | Sant Antoni de Portmany | Sant Joan de Labritja | Sant Josep de Sa Talaia | Santa Eulalia del Río |
|---|---|---|---|---|---|
| Y/E May 2025 | €6,625 | €6,702 | €7,898 | €7,089 | €7,532 |
| Y/E May 2024 | €6,585 | €5,536 | €7,349 | €6,743 | €7,028 |
| Y/E May 2023 | €5,576 | €5,333 | €7,067 | €6,387 | €6,426 |
| Y/E May 2022 | €5,240 | €4,175 | €6,189 | €5,626 | €5,628 |
| Y/E May 2021 | €4,840 | €3,770 | €6,243 | €4,939 | €4,913 |
| Y/E May 2020 | €5,019 | €4,051 | €5,468 | €5,011 | €4,772 |
| Y/E May 2019 | €5,186 | €3,954 | €5,252 | €5,004 | €4,757 |
| Y/E May 2018 | €5,040 | €3,753 | €5,597 | €4,750 | €4,498 |
| Y/E May 2017 | €4,457 | €3,347 | €4,457 | €3,948 | €3,899 |
| Y/E May 2016 | €3,858 | €2,637 | €3,385 | €3,339 | €3,399 |
- Weighted average price in 2016: €3,452.28
- Weighted average price in 2025: €6,945.46
- Total price increase (Ibiza): +101.18%
- Compound annual growth rate (CAGR): 8.08%
Ibiza Growth Rates by Municipality
| Municipality | CAGR (2016–2025) |
|---|---|
| Sant Antoni de Portmany | 10.92% |
| Sant Joan de Labritja | 9.87% |
| Santa Eulalia del Río | 9.24% |
| Sant Josep de Sa Talaia | 8.73% |
| Eivissa | 6.19% |
Our data shows that Sant Antoni has posted the fastest price growth of any municipality on the island, averaging nearly 11% per year since 2016. This is explained by its much lower baseline of €2,637/m² - 21% below the next cheapest municipality, Sant Josep at €3,339/m² - combined with the area’s significant transformation, attracting buyers to its vibrant tourism economy, west coast villas, and increasingly cosmopolitan town centre. In 2025, prices in Sant Antoni are at a similar level to Eivissa, which, despite a slower growth rate of 6.2%, has still outperformed the national average of 5.2% by almost 19%.
Santa Eulalia and Sant Josep, which contain Ibiza’s most sought-after luxury sub-markets, have also recorded impressive growth of 9.2% and 8.7% per year respectively, despite starting from significantly higher price baselines than Sant Antoni. This highlights the island’s enduring appeal to luxury lifestyle and glamour buyers.
Sant Joan de Labritja is the least populated municipality on the island, characterised by a small number of properties in rural areas. So, despite having recorded the second highest price growth of nearly 10% per year, it is less representative of overall trends on the island due to low levels of stock.
Price Trends: Spain vs Ibiza (2016–2025)
| Year | Spain (€) | Ibiza (€) |
|---|---|---|
| Y/E May 2025 | €2391 | €6945 |
| Y/E May 2024 | €2120 | €6578 |
| Y/E May 2023 | €1976 | €5963 |
| Y/E May 2022 | €1844 | €5302 |
| Y/E May 2021 | €1786 | €4784 |
| Y/E May 2020 | €1716 | €4868 |
| Y/E May 2019 | €1693 | €4908 |
| Y/E May 2018 | €1608 | €4721 |
| Y/E May 2017 | €1512 | €4072 |
| Y/E May 2016 | €1512 | €3452 |
- As of end June 2025, Ibiza is 190.5% more expensive per sqm than the average for Spain.
- Compound annual growth rate (CAGR) for Spain: 5.22%
- Compound annual growth rate (CAGR) for Ibiza: 8.08%
- Ibiza's CAGR is 54.79% higher than Spain's CAGR.
For those who can afford to invest in Ibiza, the extra premium is completely justified by a growth rate that is over 50% higher than the national average.
Market Resilience
Ibiza's resilience in the face of significant global challenges is clearly illustrated by the way the market rebounded aggressively following the Covid pandemic. In 2020, Ibiza’s average price was €4,868, only slightly above €4,784 in 2021, showing remarkable price stability during peak COVID uncertainty. But by 2022, prices had surged to €5,302, and continued accelerating through 2023 (€5,963), 2024 (€6,578), and 2025 (€6,945). Between 2021 and 2023 alone, Ibiza’s market grew by 24.7%, while Spain’s national average rose just 10.6%, a sharp divergence that signals the beginning of a stronger growth phase, clearly visible in the change in gradient on the chart.
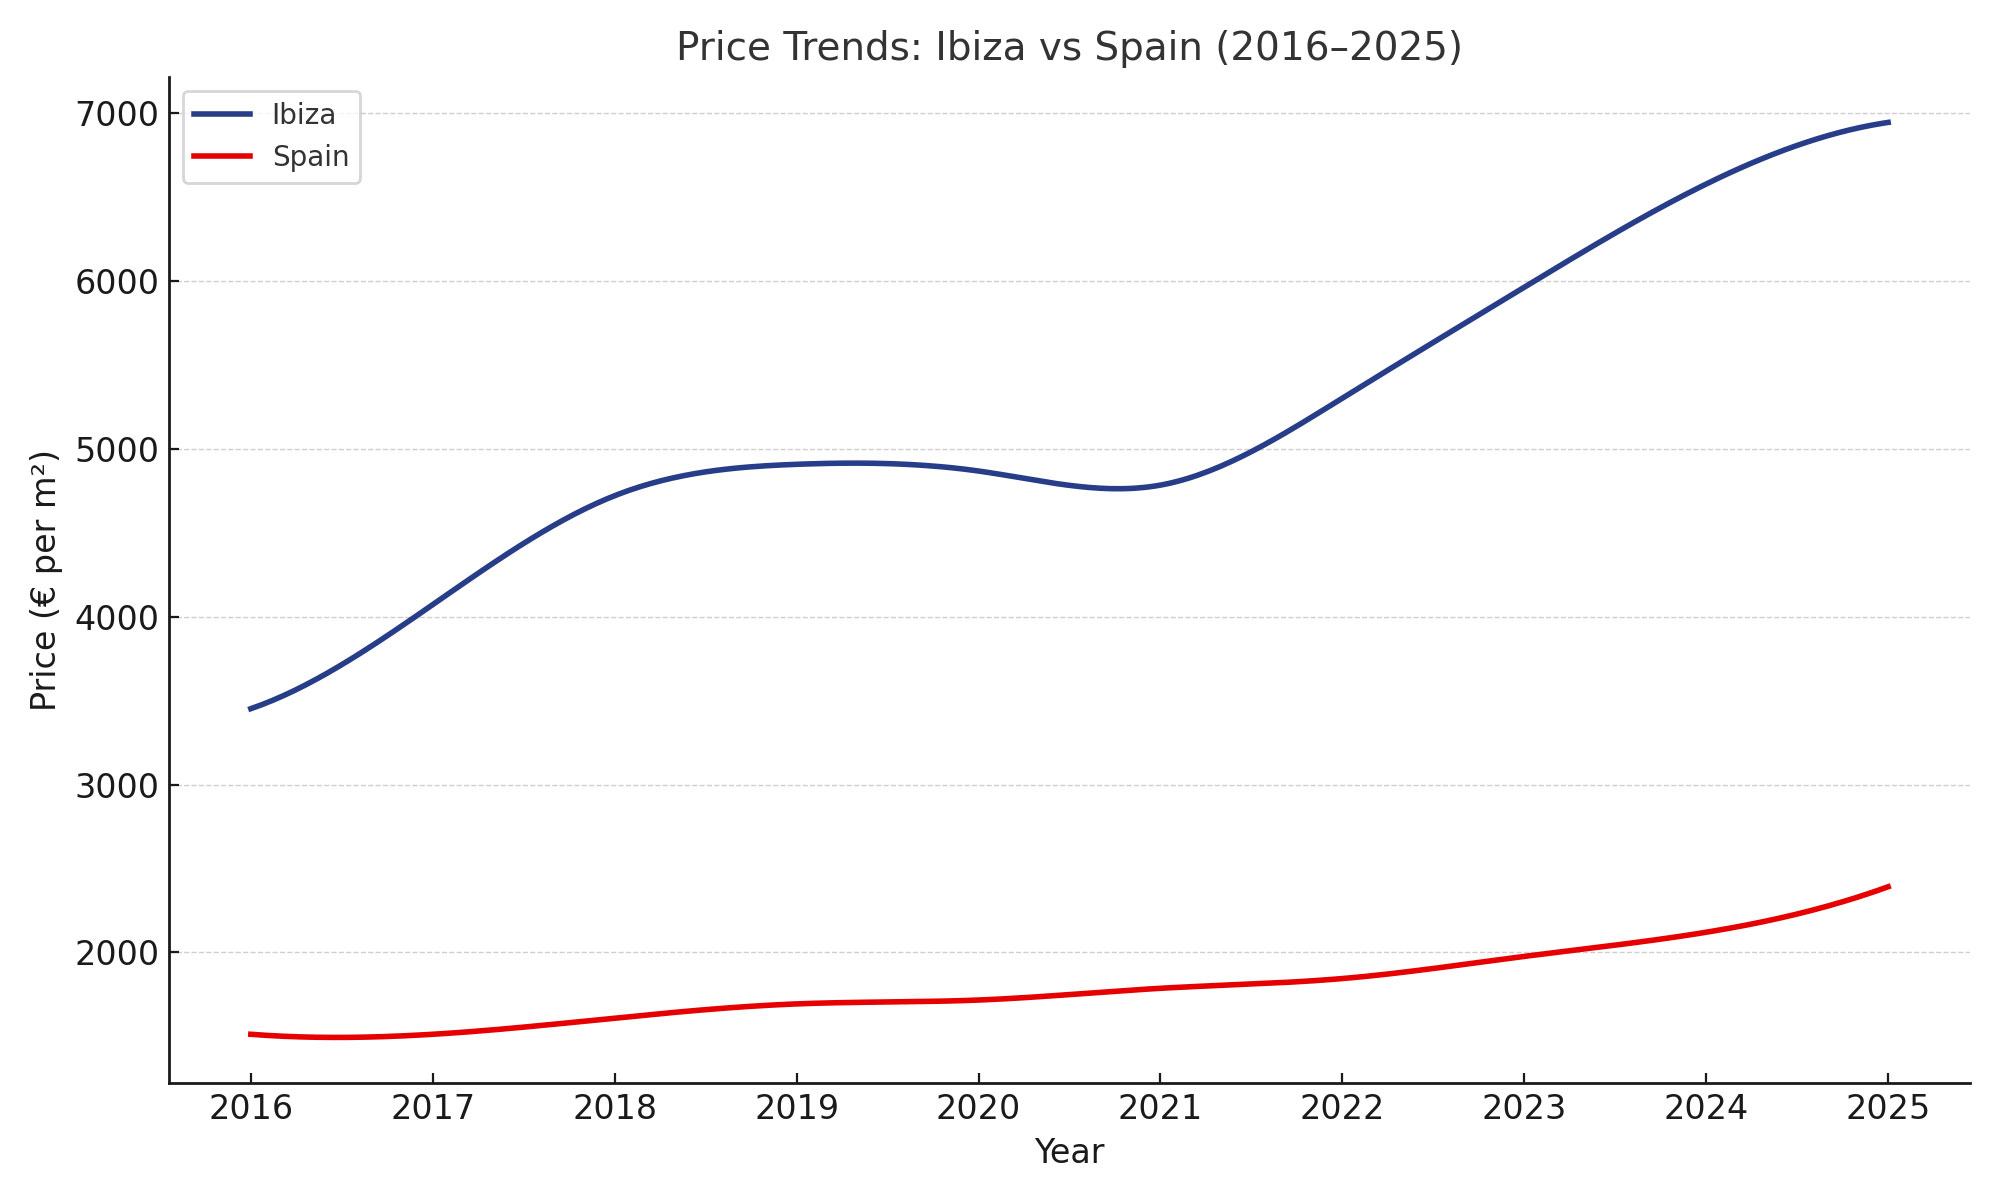
Source: Idealista
Structural Strengths
This graph highlights the structural strengths that underpin the Balearic market, and Ibiza in particular. Across the region, demand is led by high-net-worth individuals, second-home buyers, and tourism-driven investors, many of whom first encounter the islands as visitors. Leverage is typically low, and buyers are generally more resilient to global credit cycles. What sets Ibiza apart is the strength of two additional demand drivers: first, the island’s global reputation for glamour and exclusivity attracts a jet-set lifestyle segment willing to pay a premium; second, there is a deep and consistent buyer base seeking authentic fincas and country homes in the island’s interior. Together, these factors create a uniquely diverse and resilient buyer pool. Ibiza’s compound annual growth rate since 2016 has been more than 50% higher than Spain’s, clear evidence of its position as the most robust property market in the Balearics. It is also the most expensive island in the region in practical terms, excluding Formentera, which is not a major market and is largely composed of national parkland.
Ibiza Rental Yields
| Municipality | 2024 Average Rent (€/m²) |
|---|---|
| Eivissa | €27.72 |
| Sant Antoni de Portmany | €21.20 |
| Sant Josep de Sa Talaia | €24.66 |
| Santa Eulalia del Río | €24.31 |
| Balearics (all islands) | €17.86 |
- Gross rental yield: 4.27%
Based on data from Idealista, we used the average rental price per square metre for each month of 2024 to calculate a mean to use as an annual figure. We then computed an island-wide average using listing counts as of 27 July 2025 as weights, resulting in a rental average of €25.09/m²/month.
Using a weighted sales price of €7,055/m² - based on current listings across the same four municipalities - this gives a gross rental yield of 4.27%, calculated as (€25.09 × 12) ÷ €7,055.
Our gross yield of 4.27% for Ibiza is comparable but somewhat lower than the equivalent figure for Spain as a whole (4.85%), also calculated using data from Idealista, so the relative difference should be accurate. As another point of reference, as of 27 July 2025, Zoopla is quoting a gross rental yield for London of 4.9%. However, we must make the distinction that these are for long-term rentals - Idealista advertises for rental periods of one month or more.
The real opportunity for high rental returns in Ibiza, not surprisingly, lies in short-term lets, allowing investors to capitalise on the thriving tourist sector, where net rental returns of 8% or more are achievable.
Note: Our rental sample includes four Ibiza municipalities. We used current listing volumes for both rental and sales markets for these municipalities to calculate weighted averages. This ensures the gross yield figure reflects as accurately as possible the available properties across the island.
Looking Forward: 2025 and Beyond
In order to give an informed view on where the Ibiza property market is heading throughout the rest of 2025 and beyond, we make our assessment from three angles:
- Projecting current price trends forward
- Sentiment from Property Market Professionals
- Global Volatility Vs. Market Resilience
Projecting Current Price Trends Forward
Our figures are based on Idealista’s cleaned price data per square metre, adjusted using our own weighting model to reflect live listing volumes across Ibiza’s five main municipalities as of 5th August 2025.
Below we have calculated our own weighted average price per square metre for Ibiza for the last six months:
| Month | Ibiza Weighted Avg (€/m²) |
|---|---|
| Jul-25 | €7,232 |
| Jun-25 | €7,204 |
| May-25 | €7,080 |
| Apr-25 | €7,034 |
| Mar-25 | €6,943 |
| Feb-25 | €6,901 |
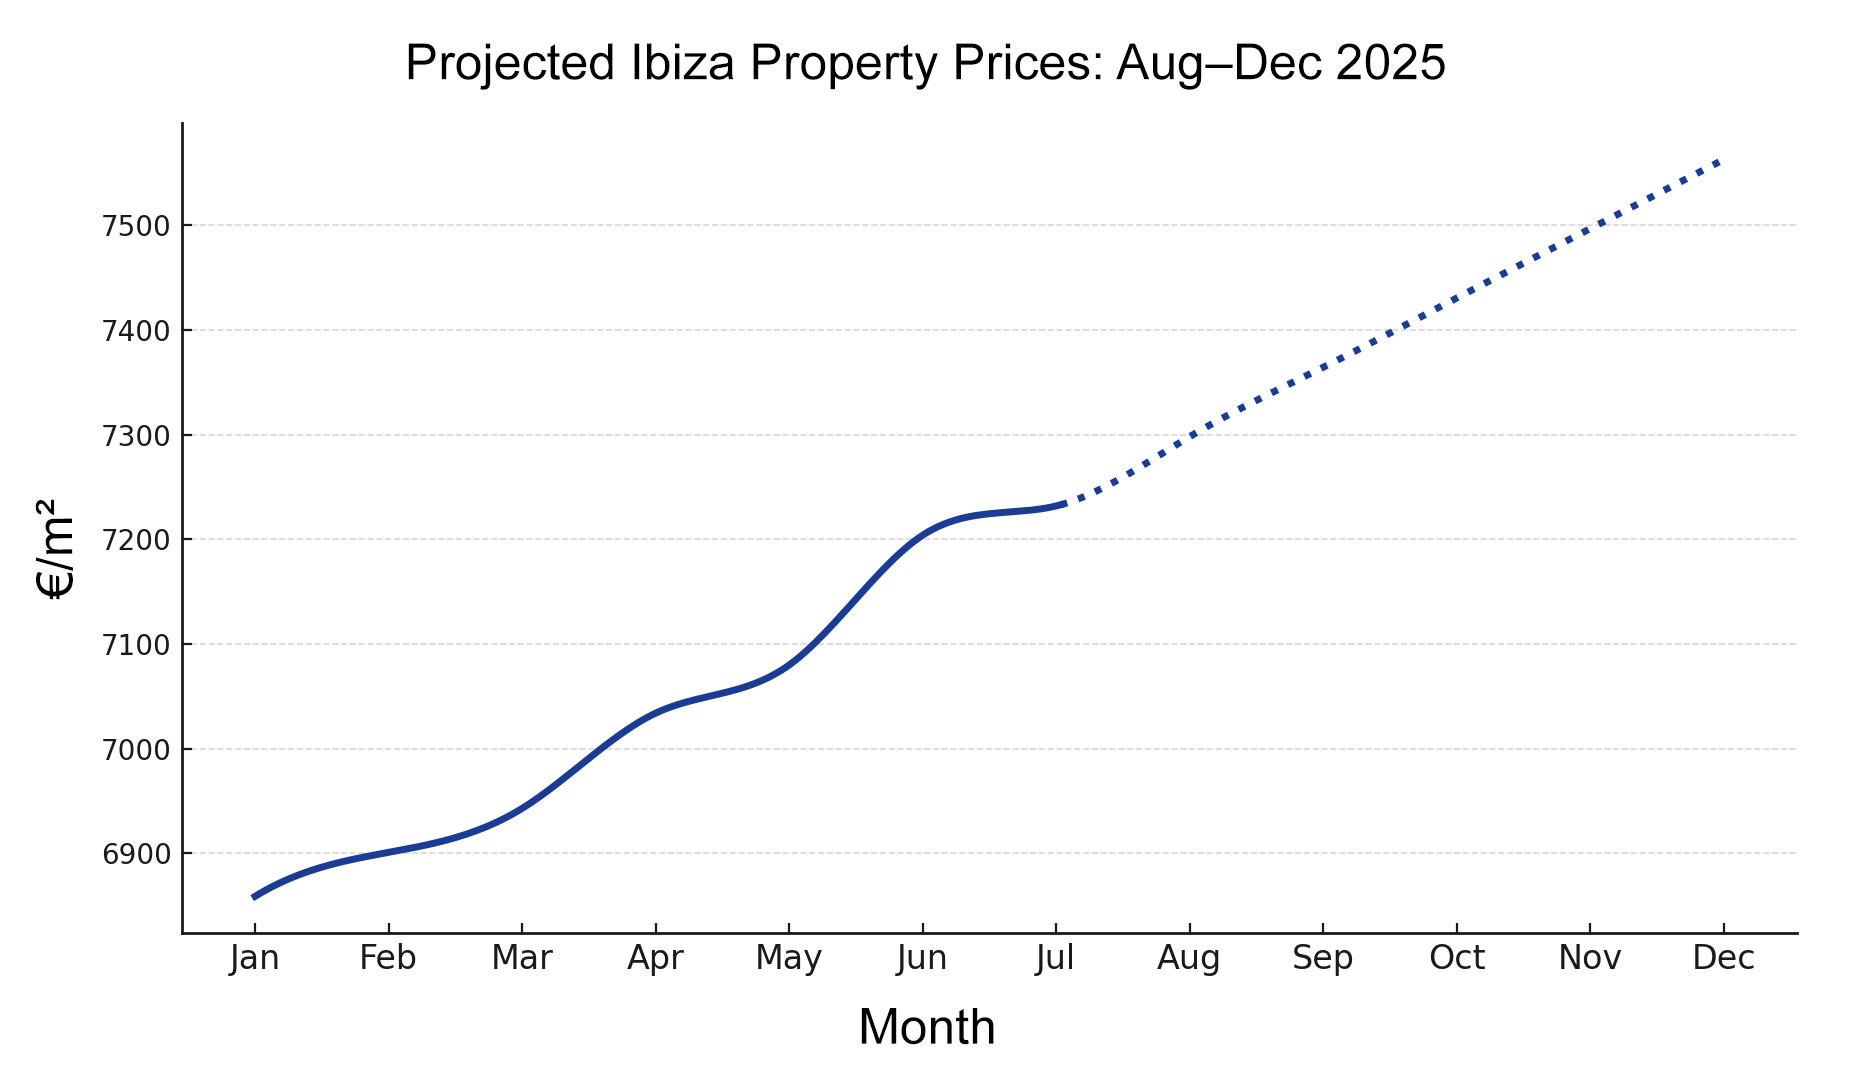
From the table above showing our Ibiza price movements between February and July 2025, we have calculated a compound monthly growth rate of 0.94%. This rate has been used to project price levels for the rest of 2025:
| Month | Projected Avg Price (€/m²) |
|---|---|
| Aug | €7,300 |
| Sep | €7,369 |
| Oct | €7,438 |
| Nov | €7,508 |
| Dec | €7,579 |
Sentiment from Property Market Professionals
The general consensus among established agencies in Ibiza points to price growth for 2025 close to double digits. Prestige Properties forecasts up to a 10% rise in values, while other firms report stable demand, increased negotiability, but no signs of systemic price declines. An average price increase of 10% for the year ties in closely with our own projection, based on a compound monthly growth rate of 0.94% calculated from price movements over the past six months. Annualised, this equates to an increase of 11.8%, which aligns closely with sentiment being reported on the ground when you take into account two notable factors: reported market behaviour of consolidation - for example, LET US Ibiza expect some sellers to reduce prices by 5–10% - and a significant decline in tourist numbers.
We need to acknowledge the significant drop in tourist numbers for the second half of 2025, with travel interest to Ibiza down 56% year-on-year according to Travel and Tour World (May 3, 2025). Yes, tourism is a key driver of the Ibiza property market, because most investors come to view the island as tourists. However, the buyer profile is wealthier, lifestyle-driven, and not part of the mass tourism segment. Any reduction in property prices following a decline in tourism typically comes with a significant time lag. Therefore, the dampening effect on prices is likely to be limited in the short term to medium term, and especially in core and luxury segments.
Global Volatility Vs. Market Resilience
Despite all signals pointing toward continued steady price growth for the second half of 2025, we need to recognise that the global climate this year is without doubt the most volatile in recent times. History tells us that Ibiza has a remarkable ability to recover from the most severe global shocks, from the global financial crisis of 2008 to the COVID pandemic. The structural strengths that underpin the wider regional market of the Balearics – luxury lifestyle buyers, high-net-worth investors, relatively low levels of leverage, a higher percentage of second-home buyers – are even more pronounced in Ibiza. The island's property market is also further strengthened by the uniquely glamorous brand of Ibiza, appealing to the jetsetter crowd, which is more insulated from economic downturn than the typical real estate investor.
However, the volatility of this year is like none ever seen before. The completely unorthodox approach of the current U.S. administration, where unrelated issues are bundled into the mix within geopolitical discussions, has undoubtedly added to the unpredictability facing global markets. A clear example is the recent shift in tone regarding the war in Ukraine. Frustrated by the lack of progress, on the 4th of August 2025, the U.S. abruptly threatened secondary tariffs on countries continuing to purchase oil from Russia – including India, China, and Brazil. These may ultimately prove to be negotiating tactics. Whether or not these threats succeed in curbing Russian oil sales, the net effect on global GDP is likely to be negative – either through reduced supply and rising oil prices, or through the imposition of secondary tariffs that introduce new inflationary pressures and dampen global demand.
By its very nature, volatility is unpredictable, so we really cannot say what global shocks lie ahead. But one thing most analysts will agree on is that even in the worst-case scenario, the effects on the global economy are unlikely to be anywhere near as severe as those following the global financial crisis – which saw the global economy contract by 0.1%. Following the GFC, the whole Balearic region, driven largely by sustained international demand, recovered remarkably quickly, with price growth returning by 2009. Within the region, Ibiza is the most luxurious submarket, giving it additional strength and resilience.