Pollença Property Snapshot and Price Trends 2025
To find out the price distribution of properties for sale in Pollença, segmented by property type - villas and houses, apartments, and penthouses - we analysed 536 live listings on Kyero as of 31 July 2025.
To highlight long-term price trends, we use 10 years of cleaned average price data from Idealista to calculate compound annual growth rates, comparing these to the regional average. This serves as a very good indicator for Mallorca overall, as the island accounts for around 80% of listings in the Balearics.
Key Findings
When looking at the distribution of villas and houses as one group, and apartments as another, across a range of price points in Pollença compared to Mallorca overall, Pollença has a higher percentage of listings in the luxury price brackets — specifically over €2M for both property types. This higher proportion of high-end listings is due to the significant volume of luxury stock in Puerto de Pollença, which skews the overall result. However, because of the large number of properties at lower price points, the average price for both villas and apartments in Pollença remains lower than the Mallorca-wide average.
Over the past 10 years, price trends in Pollença and Mallorca have closely mirrored each other, with similar levels and rates of growth throughout the period.
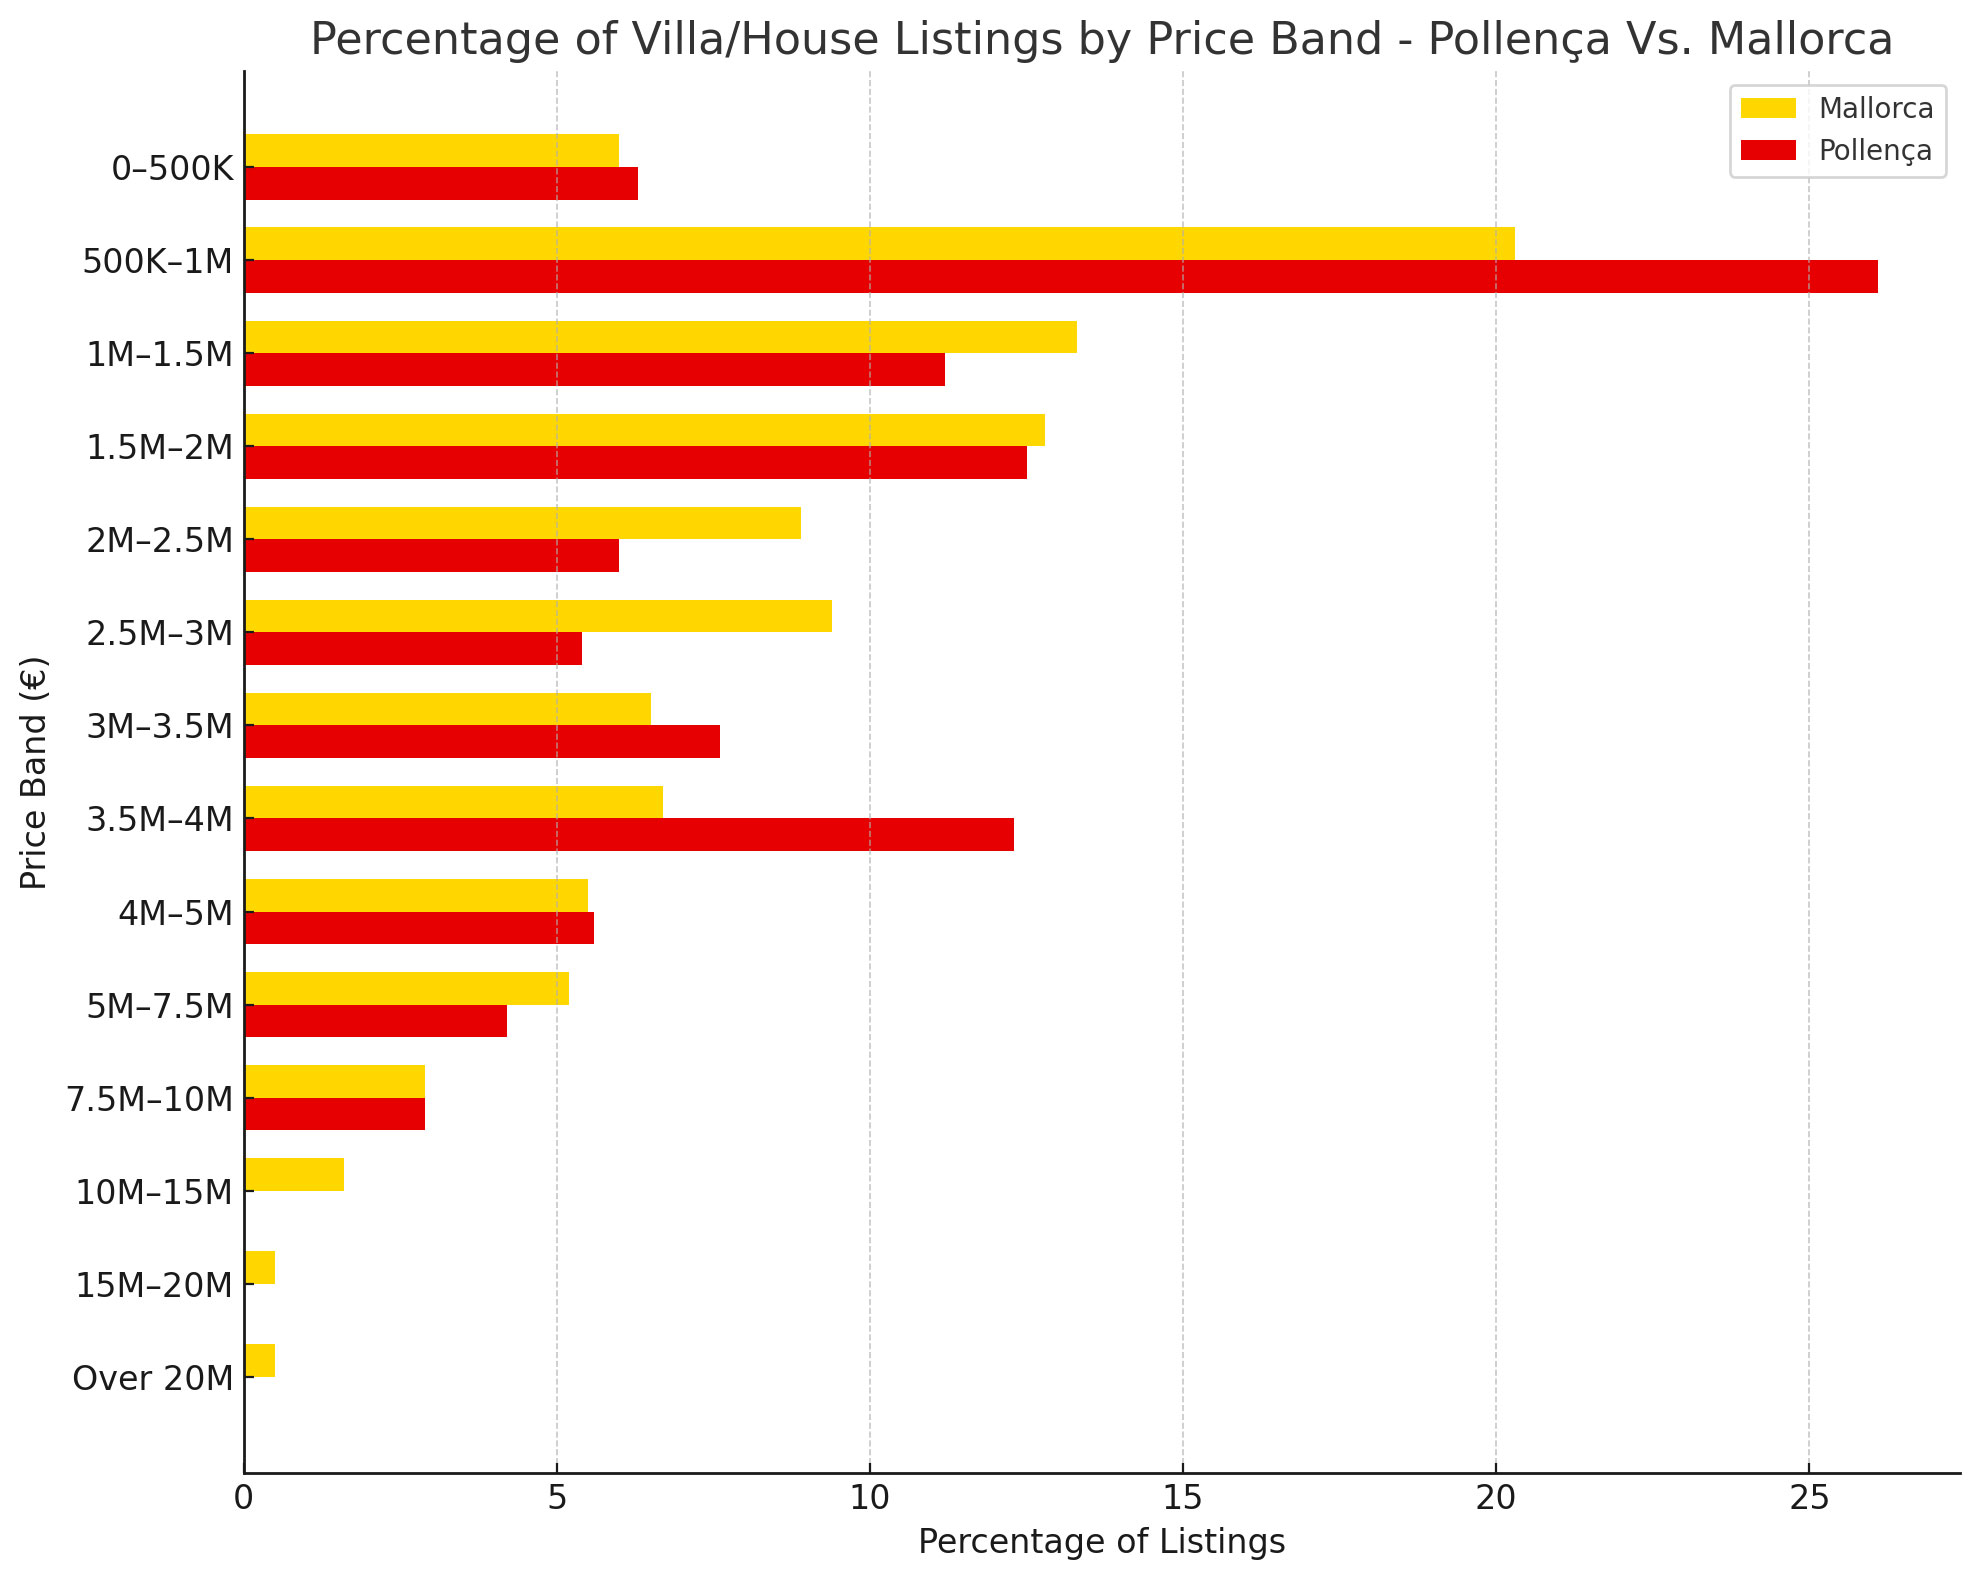
Pollença Vs. Mallorca: The Percentage of Villas Listed Above Key Price Points
|
Over €500K: • Pollença: 93.8% • Mallorca: 94.0% |
Over €1M: • Pollença: 67.6% • Mallorca: 60.4% |
Over €2M: • Pollença: 44.0% • Mallorca: 38.7% |
|
Over €3M: • Pollença: 32.6% • Mallorca: 29.3% |
Over €5M: • Pollença: 7.1% • Mallorca: 10.6% |
Over €10M: • Pollença: 0.0% • Mallorca: 1.6% |
Pollença Villa/House Listings by Price Band (Kyero, July 31st 2025)
| Price Band (€) | Listings (Pollença) | % of Total |
|---|---|---|
| 0–500K | 28 | 6.3% |
| 500K–1M | 117 | 26.1% |
| 1M–1.5M | 50 | 11.2% |
| 1.5M–2M | 56 | 12.5% |
| 2M–2.5M | 27 | 6.0% |
| 2.5M–3M | 24 | 5.4% |
| 3M–3.5M | 34 | 7.6% |
| 3.5M–4M | 55 | 12.3% |
| 4M–5M | 25 | 5.6% |
| 5M–7.5M | 19 | 4.2% |
| 7.5M–10M | 13 | 2.9% |
| 10M–15M | 0 | 0.0% |
| 15M–20M | 0 | 0.0% |
| Over 20M | 0 | 0.0% |
Average listing price for Pollença villas and houses: €2,329,799
Calculated using weighted averages
Mallorca Villa/House Listings by Price Band (Kyero, July 21st 2025)
| Price Band (€) | Listings (Mallorca) | % of Total |
|---|---|---|
| 0–500K | 558 | 6.0% |
| 500K–1M | 1,881 | 20.3% |
| 1M–1.5M | 1,228 | 13.3% |
| 1.5M–2M | 1,186 | 12.8% |
| 2M–2.5M | 820 | 8.9% |
| 2.5M–3M | 874 | 9.4% |
| 3M–3.5M | 598 | 6.5% |
| 3.5M–4M | 622 | 6.7% |
| 4M–5M | 509 | 5.5% |
| 5M–7.5M | 486 | 5.2% |
| 7.5M–10M | 267 | 2.9% |
| 10M–15M | 144 | 1.6% |
| 15M–20M | 42 | 0.5% |
| Over 20M | 43 | 0.5% |
Average listing price for villas and houses: €2,684,381
Calculated using weighted averages
Pollença Vs. Mallorca Villa/House Listings by Price Band (Kyero, July)
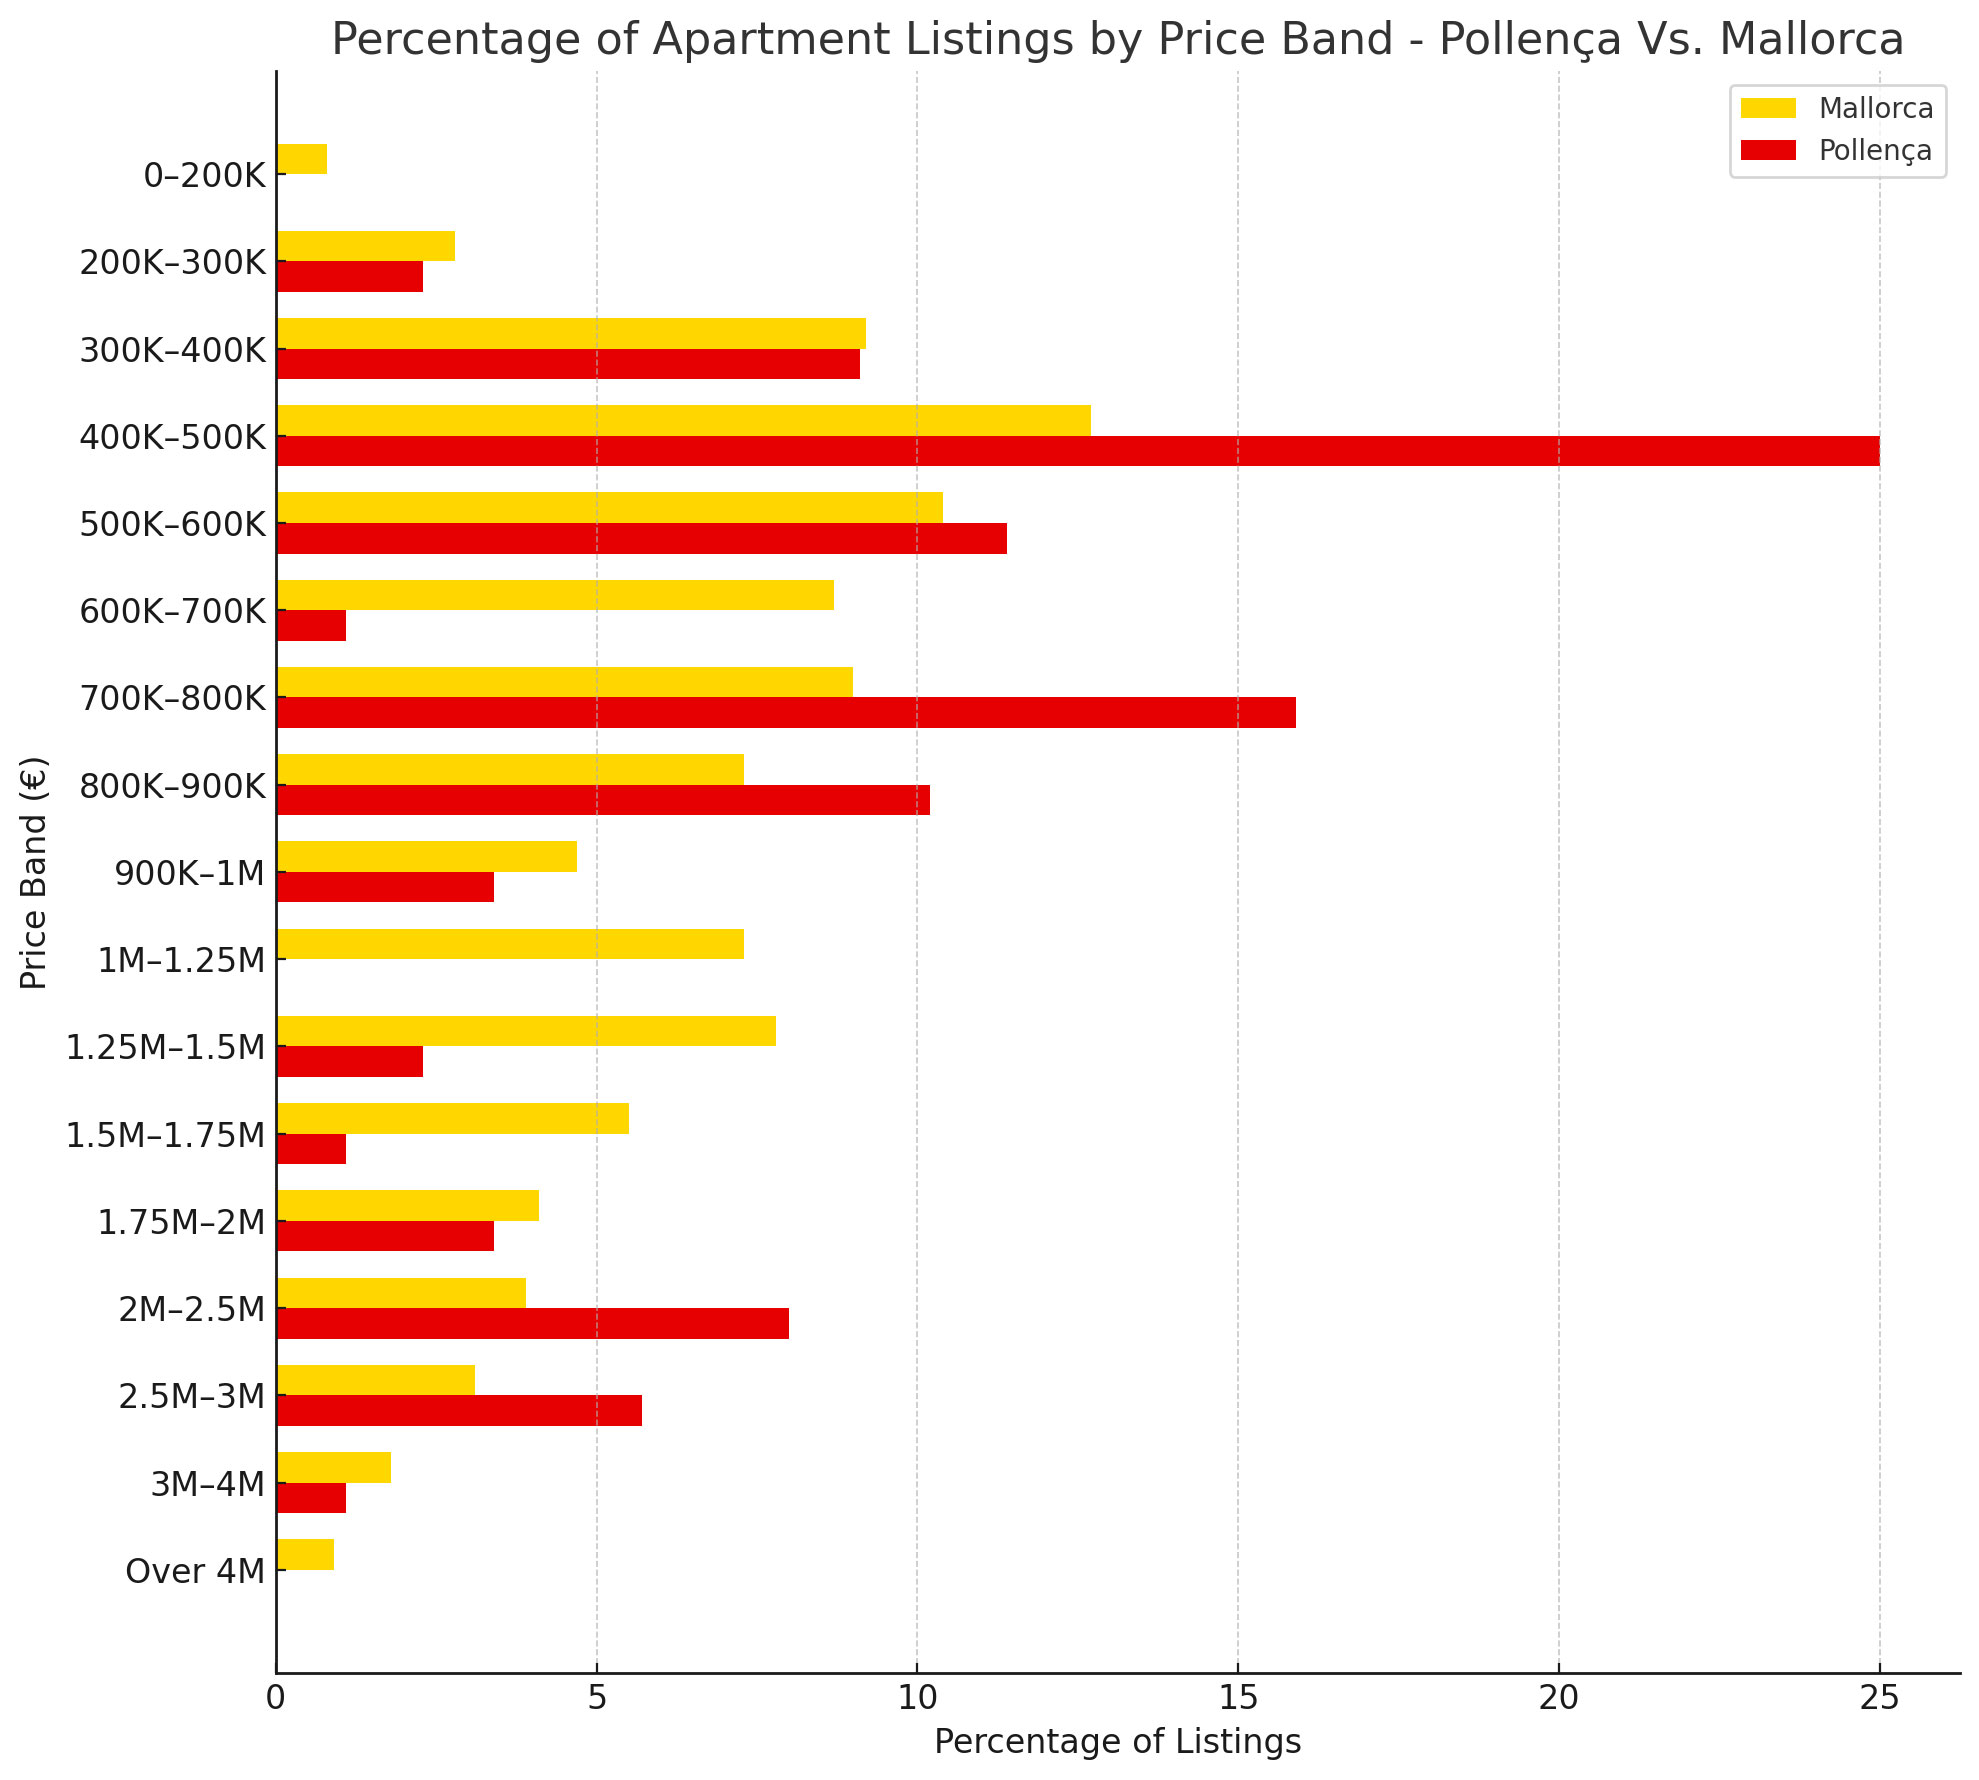
Pollença Vs. Mallorca: The Percentage of Apartments Listed Above Key Price Points
| Over €500K: • Pollença: 63.6% • Mallorca: 74.5% |
Over €1M: • Pollença: 21.6% • Mallorca: 34.4% |
Over €1.5M: • Pollença: 19.3% • Mallorca: 19.3% |
| Over €2M: • Pollença: 14.8% • Mallorca: 9.7% |
Over €2.5M: • Pollença: 6.8% • Mallorca: 5.8% |
Over €3M: • Pollença: 1.1% • Mallorca: 2.7% |
Mallorca Apartment Listings by Price Band (Kyero, July 21st 2025)
| Price Band (€) | Listings (Mallorca) | % of Total |
|---|---|---|
| 0–200K | 39 | 0.8% |
| 200K–300K | 127 | 2.8% |
| 300K–400K | 426 | 9.2% |
| 400K–500K | 585 | 12.7% |
| 500K–600K | 479 | 10.4% |
| 600K–700K | 402 | 8.7% |
| 700K–800K | 413 | 9.0% |
| 800K–900K | 336 | 7.3% |
| 900K–1M | 216 | 4.7% |
| 1M–1.25M | 335 | 7.3% |
| 1.25M–1.5M | 360 | 7.8% |
| 1.5M–1.75M | 253 | 5.5% |
| 1.75M–2M | 189 | 4.1% |
| 2M–2.5M | 180 | 3.9% |
| 2.5M–3M | 145 | 3.1% |
| 3M–4M | 81 | 1.8% |
| Over 4M | 42 | 0.9% |
Average listing price for apartments: €1,026,957
Calculated using weighted averages
Pollença Apartment Listings by Price Band (Kyero, July 31st 2025)
| Price Band (€) | Listings (Pollença) | % of Total |
|---|---|---|
| 0–200K | 0 | 0.0% |
| 200K–300K | 2 | 2.3% |
| 300K–400K | 8 | 9.1% |
| 400K–500K | 22 | 25.0% |
| 500K–600K | 10 | 11.4% |
| 600K–700K | 1 | 1.1% |
| 700K–800K | 14 | 15.9% |
| 800K–900K | 9 | 10.2% |
| 900K–1M | 3 | 3.4% |
| 1M–1.25M | 0 | 0.0% |
| 1.25M–1.5M | 2 | 2.3% |
| 1.5M–1.75M | 1 | 1.1% |
| 1.75M–2M | 3 | 3.4% |
| 2M–2.5M | 7 | 8.0% |
| 2.5M–3M | 5 | 5.7% |
| 3M–4M | 1 | 1.1% |
| Over 4M | 0 | 0.0% |
Average listing price for Pollença apartments: €947,159
Calculated using weighted averages
Pollença Vs. Mallorca Apartment Listings by Price Band (Kyero, July)
Price per Square Metre – Pollença Vs. Mallorca (Idealista 2016–2025)
| Year | Pollença (€/m²) | Mallorca (€/m²) |
|---|---|---|
| 2016 | €2,189 | €2,014 |
| 2017 | €2,817 | €2,266 |
| 2018 | €3,070 | €2,674 |
| 2019 | €2,890 | €3,002 |
| 2020 | €2,970 | €3,089 |
| 2021 | €3,232 | €3,177 |
| 2022 | €3,174 | €3,443 |
| 2023 | €3,446 | €3,954 |
| 2024 | €4,021 | €4,379 |
| 2025 | €4,372 | €4,996 |
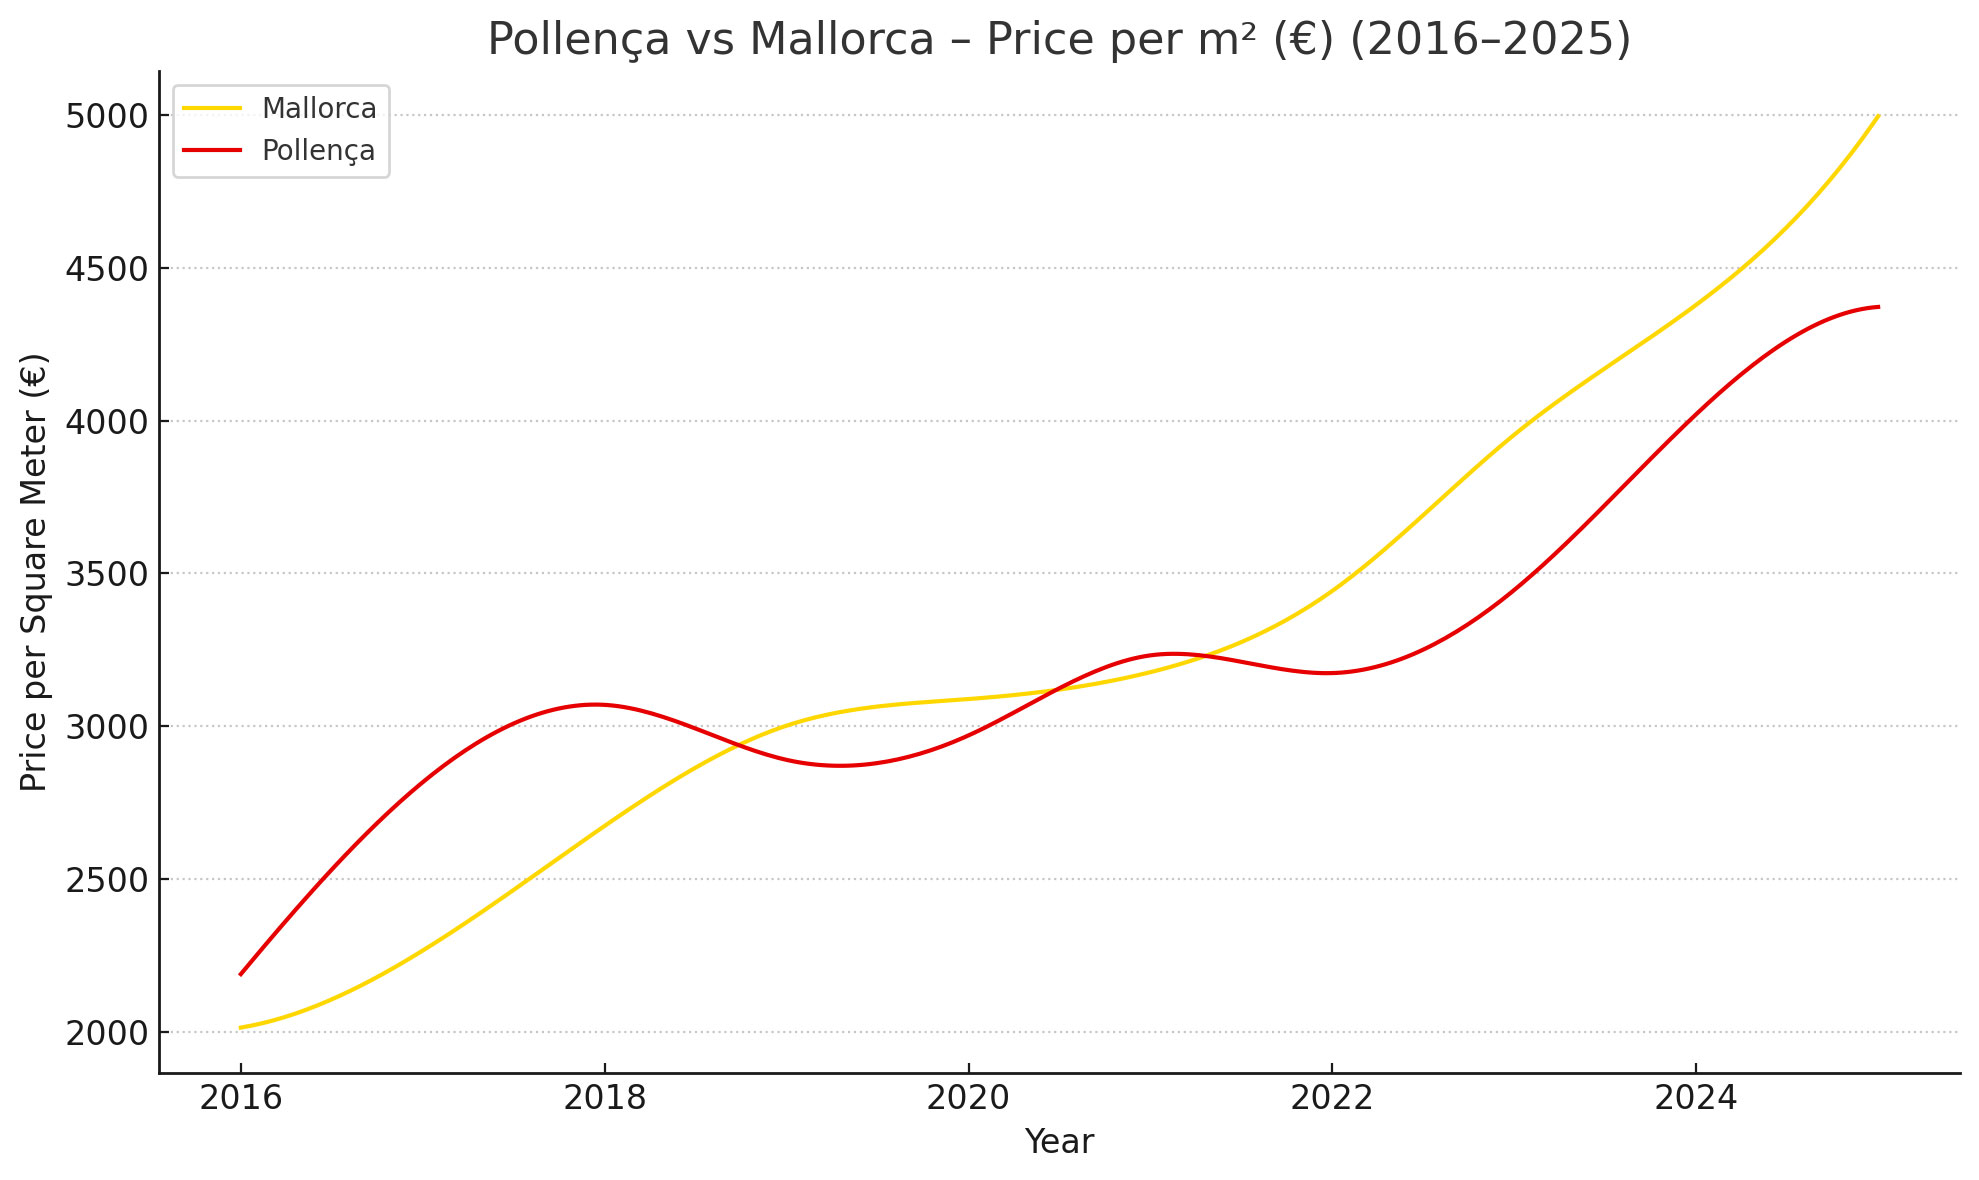
Pollença vs Mallorca: 10-Year Growth Comparison
From 2016 to 2025, average property prices in Pollença grew at a compound annual rate of 5.45%, closely matching the 5.56% annual growth rate observed across Mallorca as a whole. As of June 2025, Pollença’s average price per square metre stands at €4,372, slightly below the island-wide average of €4,996 – a marginal discount of around 1.8%.
Note: Balearic-wide data is used as a proxy for Mallorca pricing, as the island accounts for around 80% of total transactions.
Interested in buying? View our property for sale in Pollença