Distribution of Koh Samui Property Types by Price Band
The data below is based on our analysis of over 850 live listings from multiple sources, captured on 27 July 2025. We’ve grouped the properties into two categories: villas and houses (including townhouses), and apartments and condominiums. The aim is to provide a clear, transparent snapshot of how property prices are distributed across Koh Samui, offering useful insight for property investors.
Note: Our data set only includes properties prices up to 100M THB.
The Percentage of Villas and Houses Listed Above Key Price Points
| Over 5M THB: • Villas & Houses: 96.4% |
Over 10M THB: • Villas & Houses: 79.6% |
Over 15M THB: • Villas & Houses: 56.4% |
| Over 20M THB: • Villas & Houses: 36.2% |
Over 30M THB: • Villas & Houses: 19.8% |
Over 50M THB: • Villas & Houses: 7.4% |
Average listing price for Koh Samui villas and houses: ฿30.5 million
Median listing price for Koh Samui villas and houses: ฿17.2 million
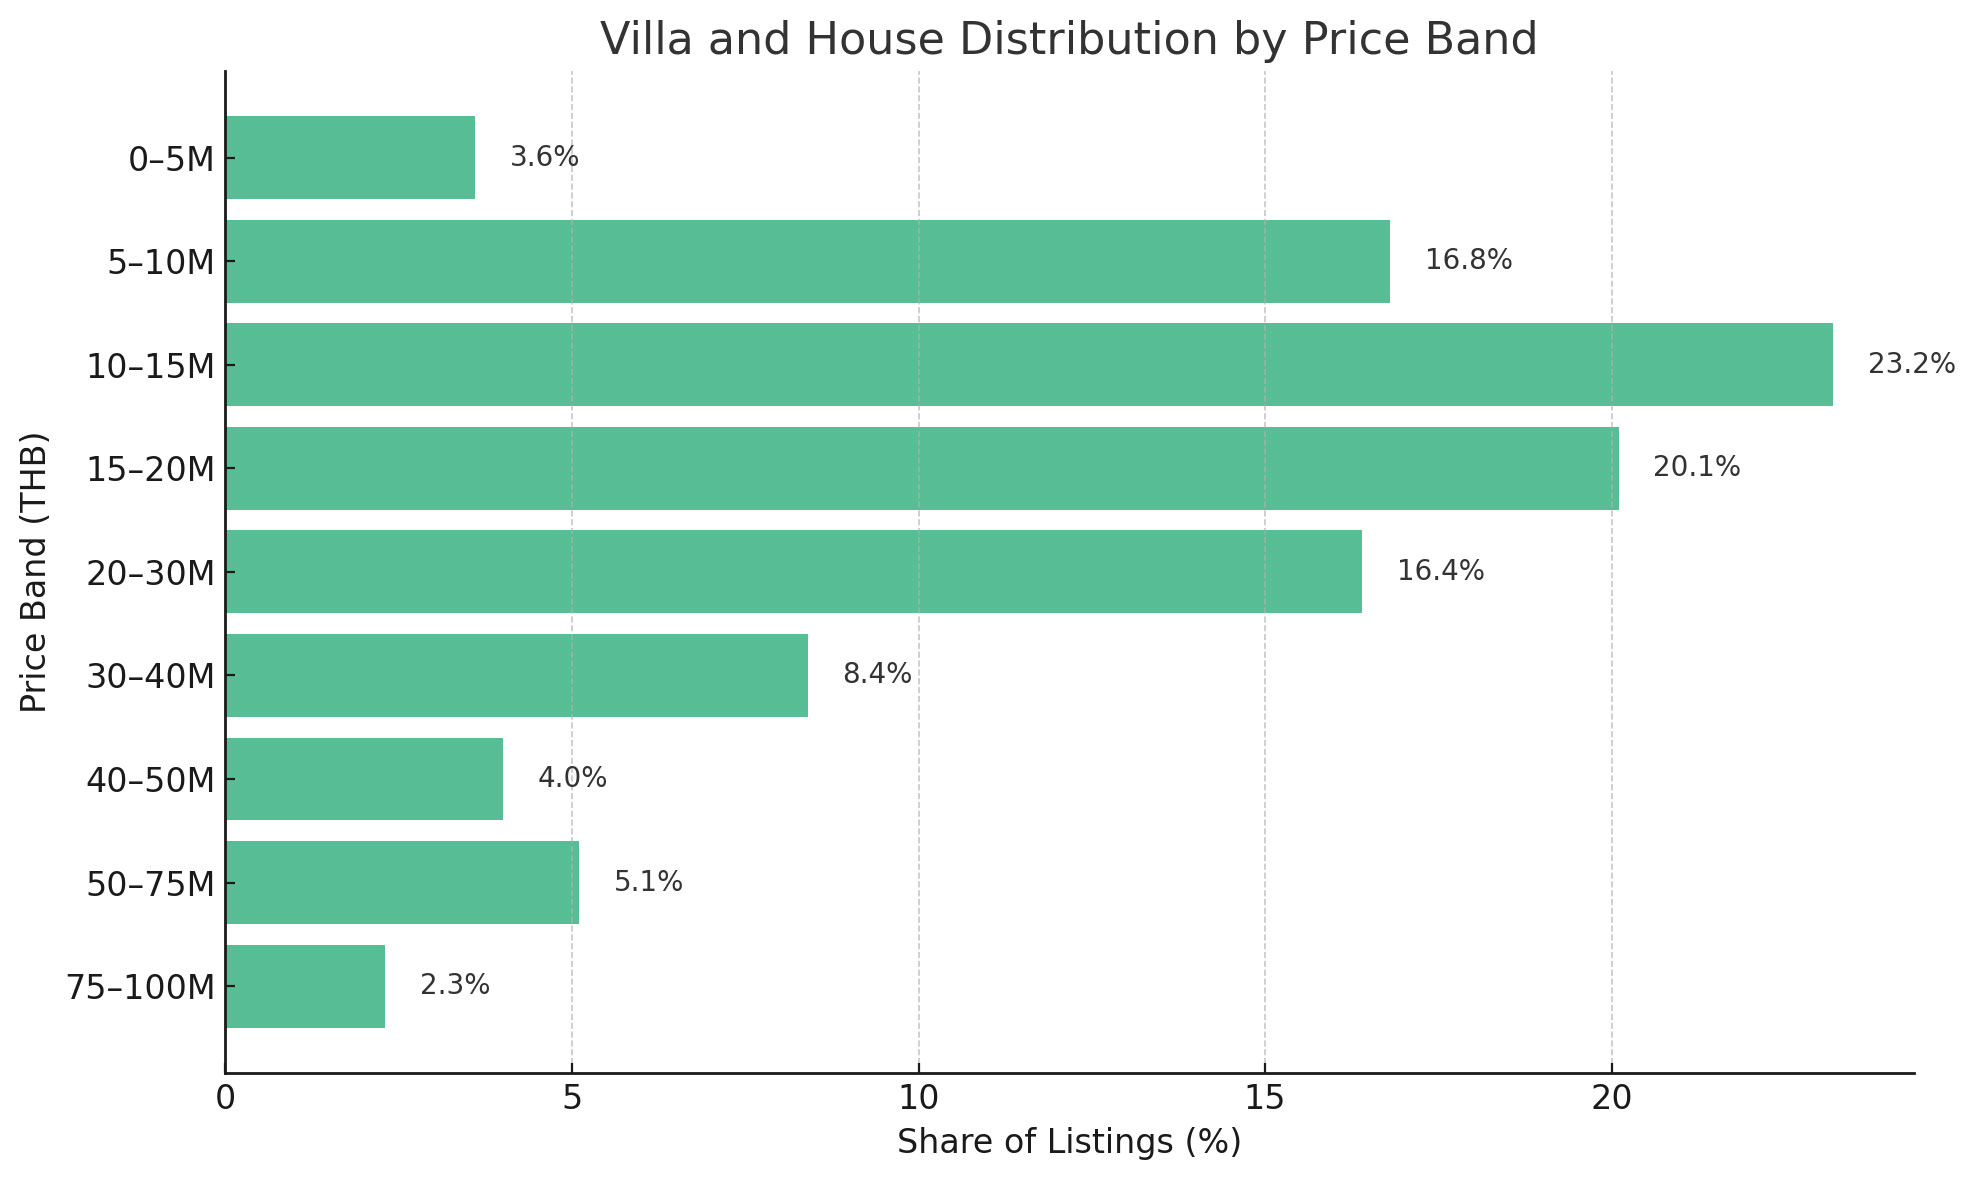
Villa and House Listings in Koh Samui by Price Band
| Price Band (THB) | Number of Listings | % of Total |
|---|---|---|
| 0–5M | 28 | 3.6% |
| 5–10M | 129 | 16.8% |
| 10–15M | 179 | 23.2% |
| 15–20M | 155 | 20.1% |
| 20–30M | 126 | 16.4% |
| 30–40M | 65 | 8.4% |
| 40–50M | 31 | 4.0% |
| 50–75M | 39 | 5.1% |
| 75–100M | 18 | 2.3% |
The Percentage of Apartments and Condos Listed Above Key Price Points
| Over 3.5M THB: • Apartments & Condos: 75.3% |
Over 5M THB: • Apartments & Condos: 51.6% |
Over 7M THB: • Apartments & Condos: 27.96% |
| Over 10M THB: • Apartments & Condos: 13.98% |
Over 12M THB: • Apartments & Condos: 8.6% |
Over 15M THB: • Apartments & Condos: 4.3% |
Average listing price for Koh Samui apartments and condos: ฿6.5 million
Median listing price for Koh Samui apartments and condos: ฿6.6 million
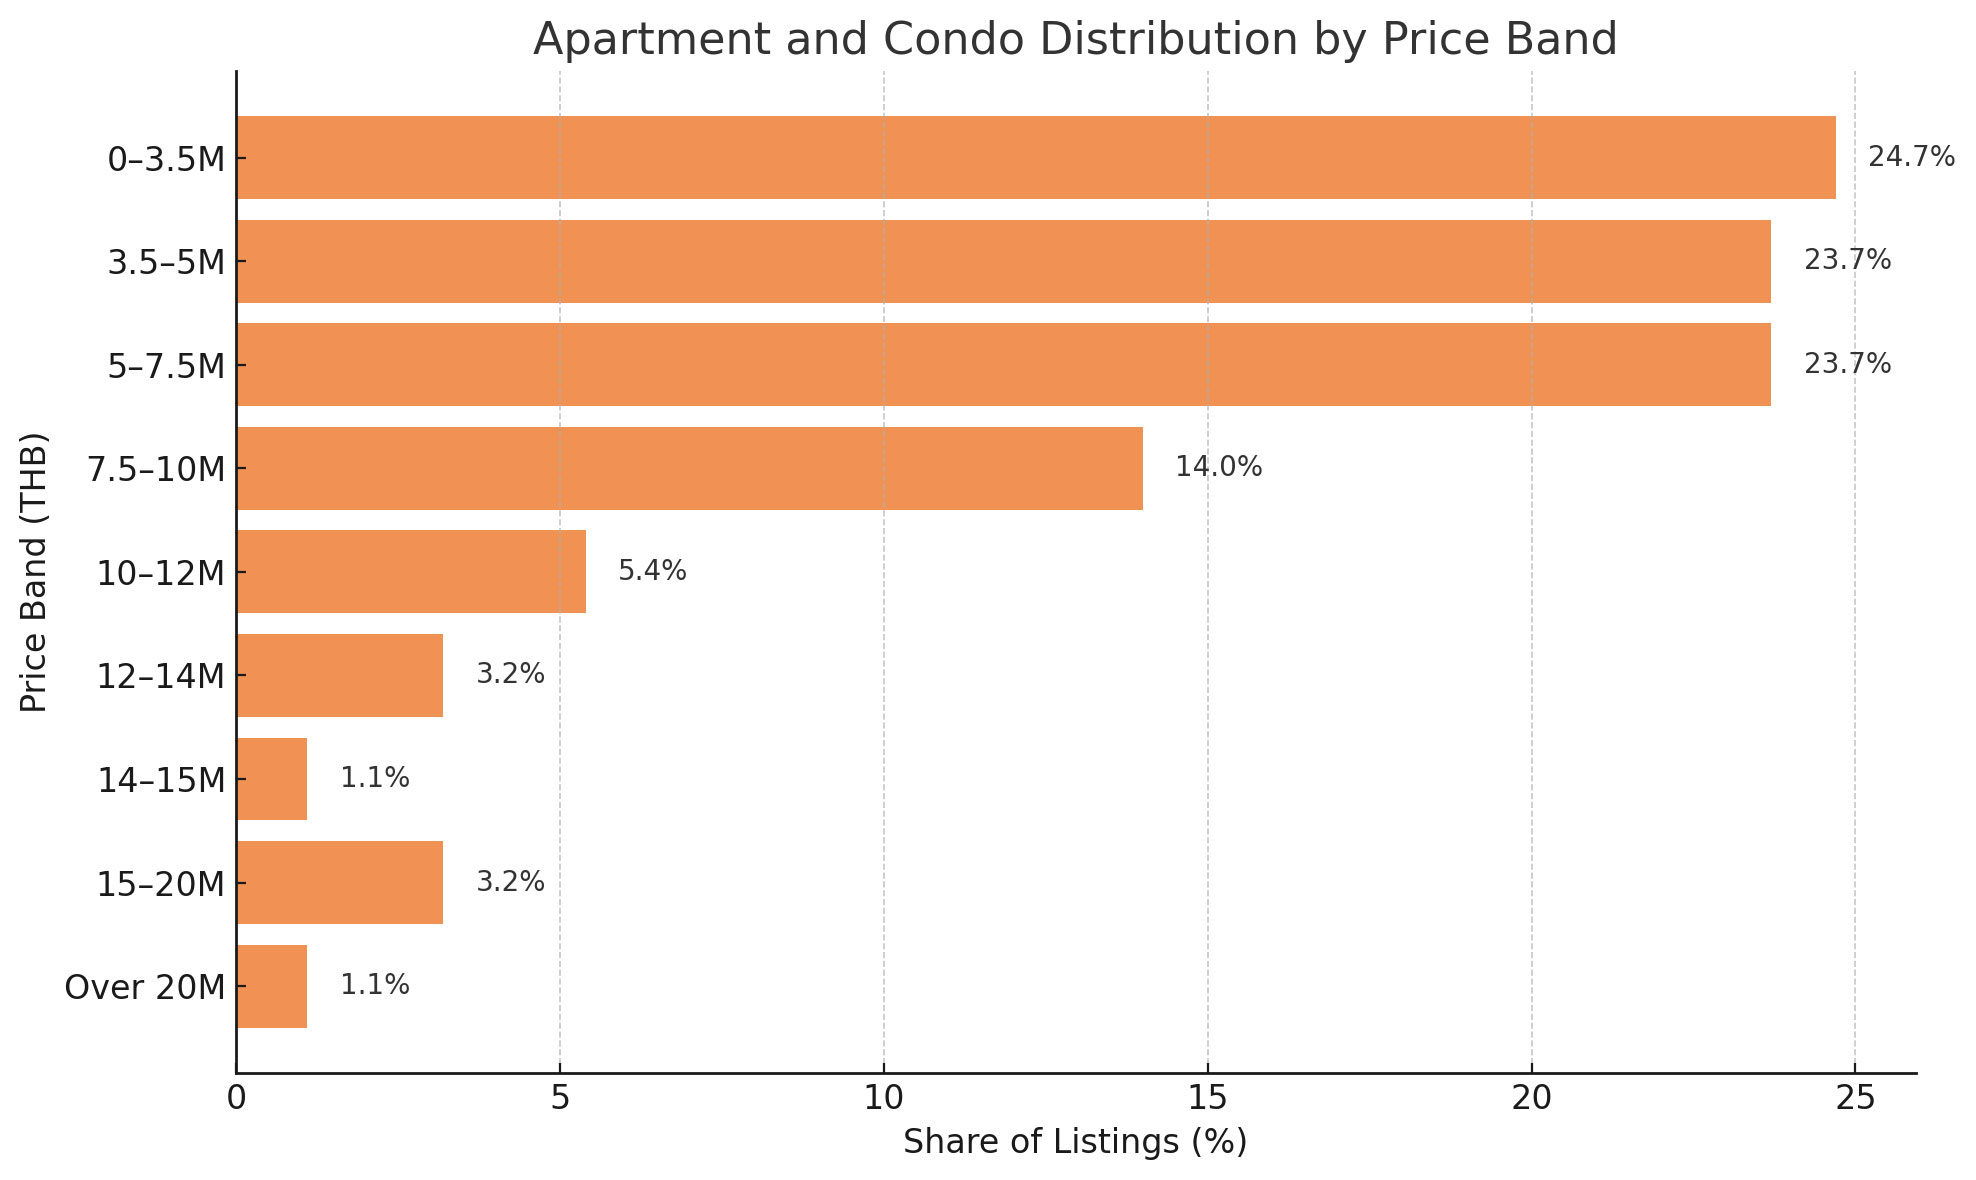
Apartment and Condo Listings in Koh Samui by Price Band
| Price Band (THB) | Number of Listings | % of Total |
|---|---|---|
| 0–3.5M | 23 | 24.7% |
| 3.5–5M | 22 | 23.7% |
| 5–7.5M | 22 | 23.7% |
| 7.5–10M | 13 | 14.0% |
| 10–12M | 5 | 5.4% |
| 12–14M | 3 | 3.2% |
| 14–15M | 1 | 1.1% |
| 15–20M | 3 | 3.2% |
| Over 20M | 1 | 1.1% |
Looking to buy? View our property for sale in Koh Samui